Two-Tower Recommendation with Cold Start Ablation
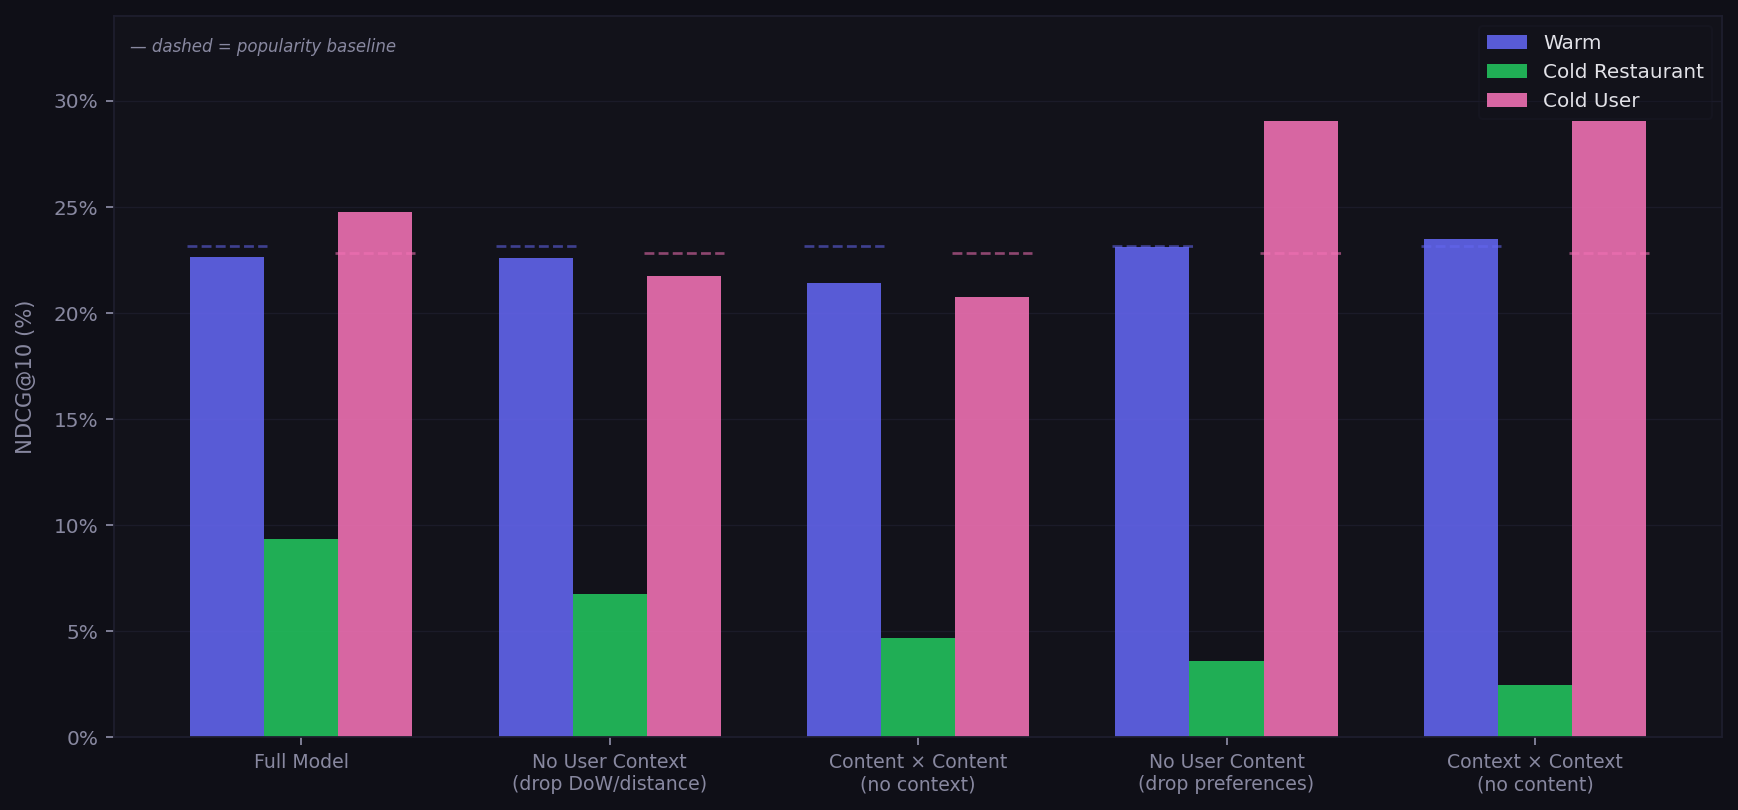
Research · Recommender SystemsFound that context features alone outperform the full model on cold-start users by 4.2 NDCG@10 points, while content features remain essential for cold restaurants. A 12-experiment ablation on a Two-Tower dual encoder over 1.3M Yelp reviews.
Key Findings
- Cold users: context-only model (day-of-week, distance, restaurant temporal profiles) achieves NDCG@10 of 29.0% — beats the full model's 24.8% and the popularity baseline by 27.2 pp
- Cold restaurants: content features are essential — dropping user preferences collapses NDCG@10 from 9.3% → 3.6%; popularity scores 0% by design (no training reviews)
- Asymmetric feature importance: dropping user preferences improves cold user performance (24.8% → 28.9%) but cuts cold restaurant performance in half — sparse preference estimates are noisier than situational context
- Checkin-matched visit times (UTC → local via per-state IANA timezone mapping) lift warm NDCG@10 by 1.7 pp and cold user by 1.9 pp
- Gated fusion underperforms on cold restaurants: content-gated interactions learned on training restaurants don't transfer to unseen ones
Engineering Highlights
- On-device feature indexing (no DataLoader, no CPU↔GPU transfer per batch); per-epoch resampling of geographic negatives and Gumbel-max onboarding selections as free data augmentation
- Leave-one-out onboarding evaluation prevents information leakage when cold users' only signal comes from test reviews
- 4-stage data pipeline (extract → preprocess → split → feature prep) with iterative interaction-density filtering and stratified cold start holdout
- Vectorized dataset construction dropped from 47s to 8s via numpy bulk operations
Lightweight CNN Encoders for Nucleus Segmentation
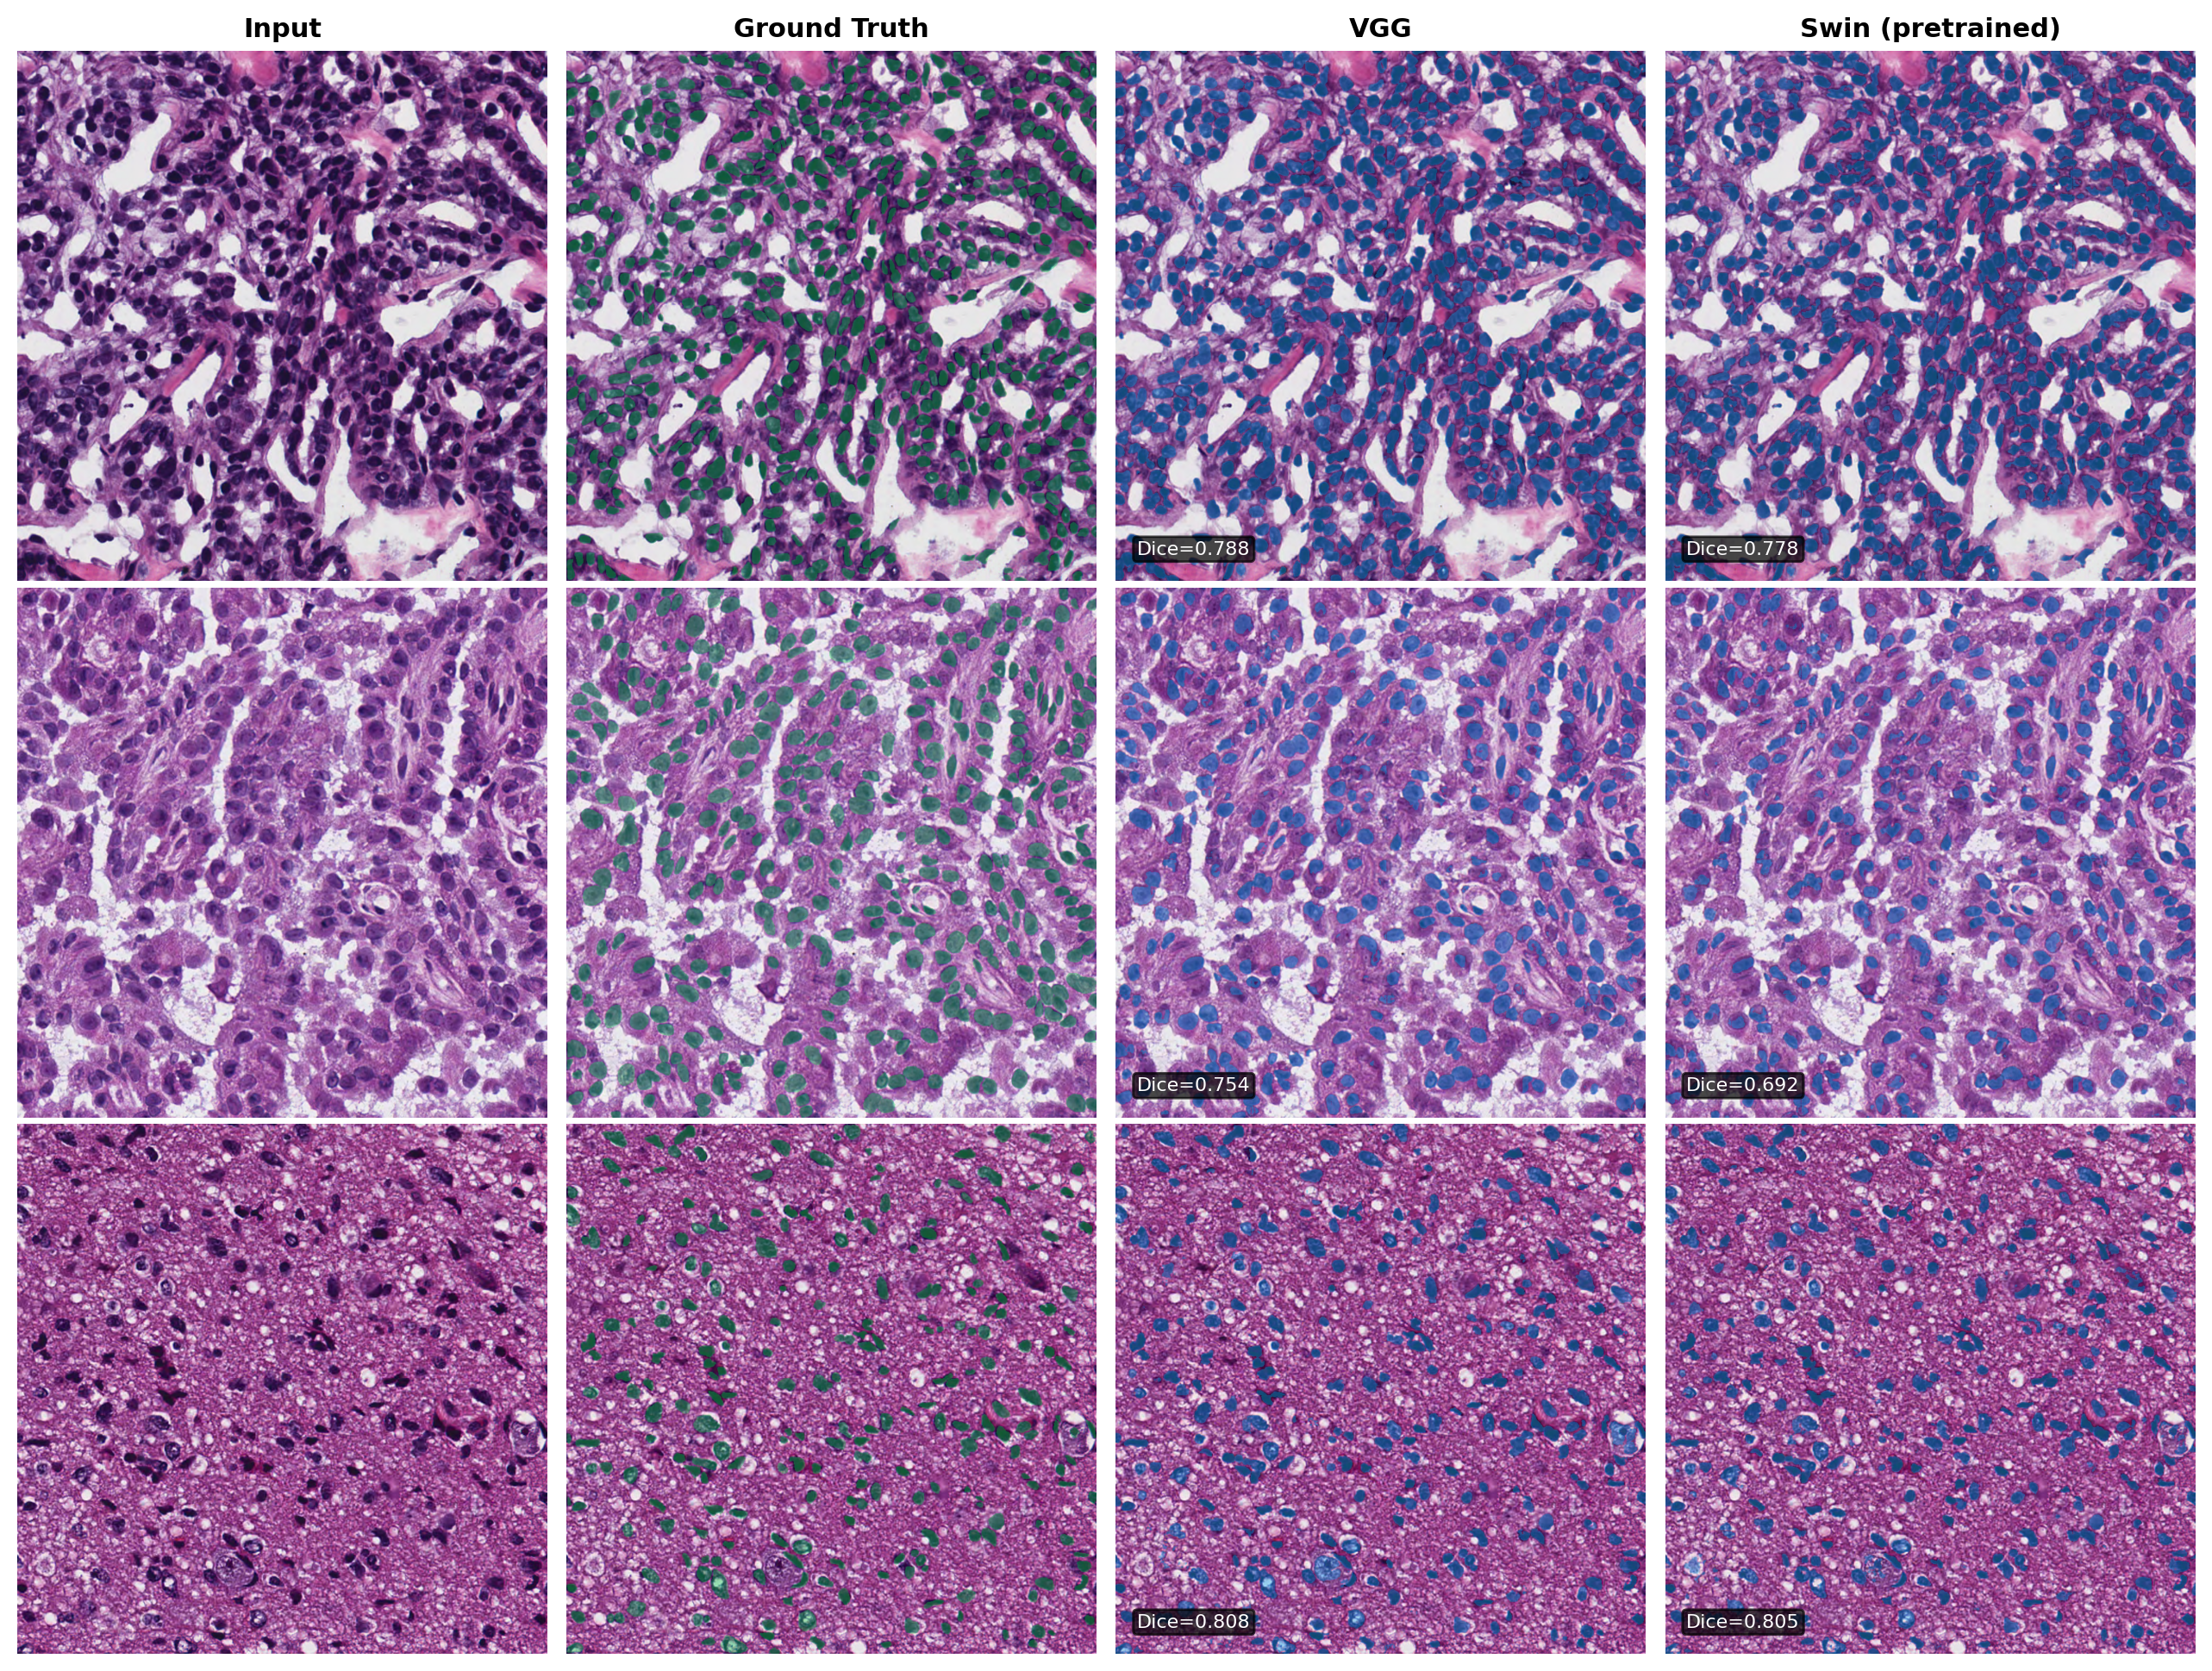
MICCAI 2026 · PosterControlled encoder ablation showing a 34M-param VGG U-Net matches MedT (a transformer purpose-built for small medical datasets) and outperforms pretrained Swin-T on nucleus segmentation in the low-data regime.
Key Findings
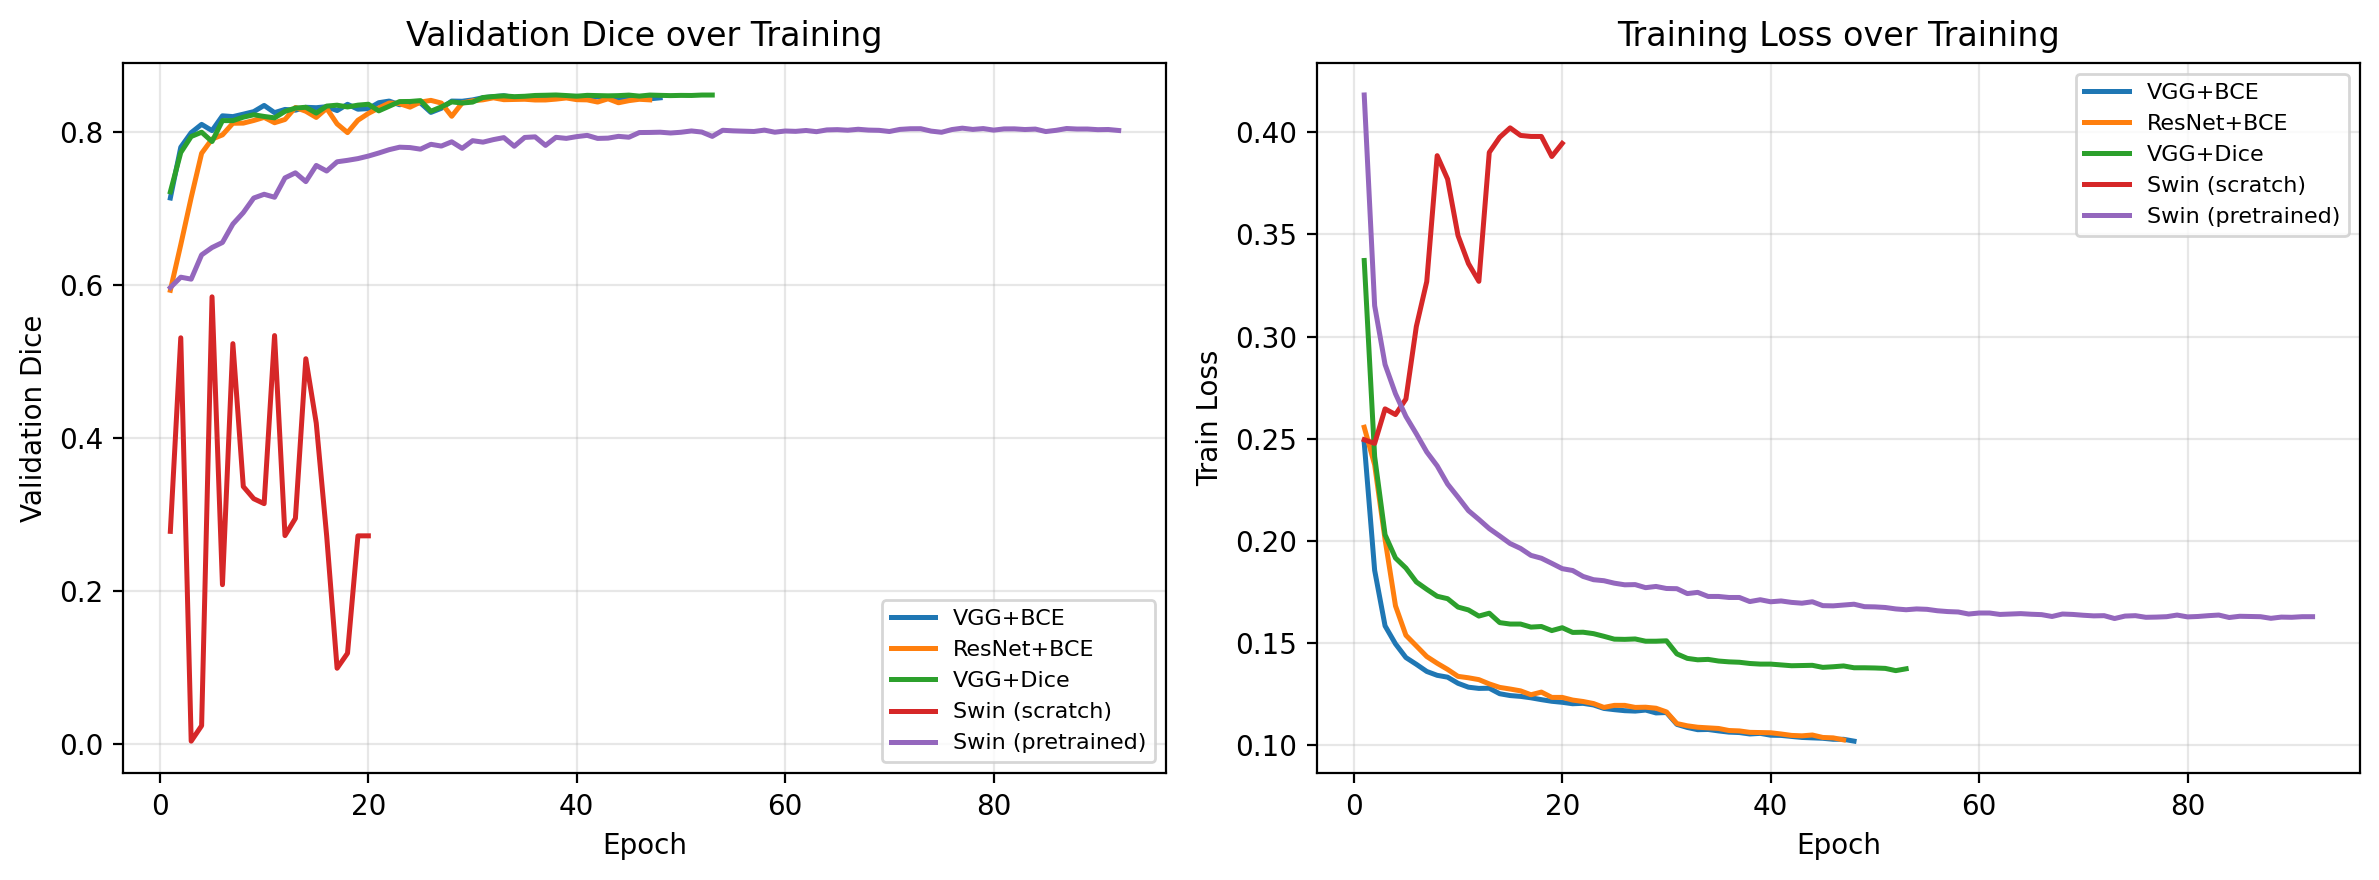
- VGG U-Net (Dice 0.851) matches ResNet and beats pretrained Swin-T by 4.9 Dice points on PanNuke (5K patches, 19 tissue types)
- On MoNuSeg (37 training WSIs), VGG reaches Dice 0.796 — equivalent to MedT's published number with a ~24× larger param budget but no specialized attention mechanism
- Pareto-dominant on inference cost: 2.6× less memory and 1.8× lower latency than Swin-T at equal-or-better accuracy
- Hypothesized mechanism: spatial-resolution preservation at skip connections + convolutional inductive bias outweighs Swin's pretraining advantage in low-data regime
- Implications for edge-deployed microscopy, veterinary/rare-disease research, and non-H&E staining where foundation model pretraining misaligns
Flow Matching for Robotic Manipulation
Research · RoboticsImitation learning via continuous-time flow matching on MuJoCo/MetaWorld bin-picking — a neural vector field transports Gaussian noise to expert action distributions via ODE integration. Scales from a proprioceptive single-object baseline to RGBD+language-conditioned action chunking across 3-object scenes.
Approach & Findings
- Flow matching policy: vector field maps (observation, noisy action, flow time τ) → velocity; RK2 integrates from τ=0→1 at inference to produce clean action samples without diffusion's iterative denoising cost
- Baseline (expt_1): proprioception-only MLP trained on 100 scripted demos achieves reliable single-object bin-picking — validates the flow matching objective on a tractable case (see demo)
- Multi-modal scaling (expt_4): RGBD CNN encoder + per-object text embedding extends the policy to 3-object scenes; 400 demos required to cover combinatorial object arrangements
- Action chunking (expt_6): predicts 8 consecutive actions (d_act 4→32) to improve temporal coherence; compounding error on the harder 3-object task highlights open generalization challenges
RailMax
Machine Learning · Public TransitInterpretable ML model (EBM) predicting annual ridership at ~500 US Amtrak stations and surfacing where increased service would have the greatest impact — with an interactive map for exploring underservice ratios and running what-if frequency scenarios.
Key Findings
- EBM achieves R² = 0.76 / RMSE 0.84 (log scale) via 5-fold stratified group cross-validation, with stations clustered geographically to prevent leakage between nearby stops
- Interactive map colors every Amtrak station by demand ratio (actual ÷ predicted ridership) and lets users adjust weekly departures to estimate ridership impact
- Features span 6 categories: geography, intermodal connectivity, service frequency, demographics (ACS), land use (colleges, tourism), and station type
- Identified top-20 city pairs most likely to benefit from increased service frequency
- Major hubs (NYC Penn, Chicago Union) systematically underpredicted — documented as a known limitation of additive cross-sectional modeling at convergence points
NJ Transit Reliability Tracker
Data Systems · Public TransitA live public tracker that continuously ingests NJ Transit's GTFS-Realtime feed and recomputes on-time performance at stricter thresholds than the agency's own 6-minute definition — NJT reports 88%, independent measurement puts it at 80.6% within 5 minutes, a 7.3 pt gap.
What It Measures
- The definition gap: NJT counts a train on time within 6-minute of schedule at its final terminal. Recomputing the same trains from the live feed gives 80.6% at 5 minutes and 95.4% at 15 — a single headline percentage hides the distribution.
- Full delay distribution rather than one rate: median 1m 18s against a P90 of 9m 22s, plus time-of-day and day-of-week heatmaps that locate when the tail actually falls.
- Change detection with a significance gate — week-over-week line movements are only called out when the swing is unlikely to be chance, so low-frequency lines need a larger shift to qualify.
- Connection reliability: for a given transfer, the share of days the outbound train was still catchable given the inbound's actual arrival; transfers under 30 observations are marked preliminary.
- Honest empty states: no synthetic sample data — measured views read "no data yet" until enough real trains are observed, and a Health page tracks coverage gaps in NJT's published months.
Engineering
- Continuous per-train arrival collection on Cloudflare Workers, running unattended since July 2026 with scheduled ingest.
- Joins three feeds of differing cadence — GTFS static schedule, monthly published performance reports back to 2017, and the live realtime stream — into one queryable store.
- Every figure is labelled by provenance (NJT official vs. independently measured) so the two are never silently mixed.
Hopewell Road Sketches
Computational Geometry · Urban PlanningA parametric pipeline that generates to-scale before/after pedestrian safety visualizations for real intersections from field measurements, NJDOT road data, and OpenStreetMap geometry — producing 2D plan views and 3D renders where every dimension traces to a source.
Approach
- Four-phase pipeline: audit and validate road-network geometry → build curb lines and corner fillets from site configuration → apply design treatments and render 2D comparisons → export to JSON for Blender 3D rendering.
- Sourced, not guessed: building heights from property tax assessor records, crosswalk positions from OSM survey data, footprints from OSM outlines, signal configurations verified against street-view imagery — the guiding rule is never to substitute a generic geometric assumption where real data exists.
- Quantified outcomes rather than illustrations: crossing distance reduction measured from geometry, time-in-roadway computed at the MUTCD pedestrian speed of 3.5 ft/s across actual travel-lane widths, turn speed from the AASHTO curve formula at tightened corners, and parking impact counted from paint geometry.
- Regression and property-based testing (pytest + Hypothesis) caught real defects a visual review would not: a 15 sq ft disagreement between the 2D and 3D crossing bands, driveway openings rendered inconsistently across views, and a drawing-extent setting silently determining junction membership.
Hopewell Area Crash & Crosswalk Map
Civic Data · Public SafetyAn interactive map of vehicle crashes and pedestrian/cyclist incidents in Hopewell Borough, NJ, paired with a field-surveyed inventory of 84 crosswalks across 44 locations and a repaving priority score built to inform local infrastructure decisions.
What It Does
- Field survey: 84 crossings graded in person with 72 photographs — 22 good, 32 fair, 10 bad, and 20 unmarked.
- Priority scoring that combines proximity to documented crash harm, survey deficiency grades, street repaving cycles, and surveyor recommendations into a ranked repaving order.
- Crossing geometry derived from OSM
footway=crossingways where they exist and computed from road centerlines where they don't. - Live data path: crash reports flow from a published Google Sheet CSV straight into a single-file Leaflet front end, so the map stays current without a rebuild; Python scripts regenerate the crosswalk JSON and photo set after survey corrections.
Booker
Agentic AIMulti-agent system for autonomous artist–venue matching with production-grade orchestration, semantic vector search, memory management, and safety guardrails.
Key Design Decisions
- Coordinator pattern with bounded iterations prevents runaway agent loops
- MongoDB Atlas Vector Search with
all-mpnet-base-v2embeddings (768-dim) for semantic artist/venue discovery by vibe and description - 3-tier memory (conversation, working, preferences) enables context-aware multi-turn interactions
- NeMo Guardrails enforce content safety and domain boundaries at inference time
- Structured tool use with Claude API for reliable, typed agent-to-tool communication
- MCP server for Claude Desktop integration with standardized tool interop
Attention-Based Machine Translation
Deep LearningSeq2seq encoder-decoder with Bahdanau and multi-head attention for Spanish→English translation, built from scratch in PyTorch.
Architecture & Results
- Implemented Bahdanau (additive) and multi-head attention mechanisms from first principles
- Encoder: bidirectional GRU producing context vectors; Decoder: GRU with attention over encoder outputs
- Achieved 81% accuracy on Spanish→English translation benchmark
- Built attention heatmap visualizations showing learned alignment patterns
- Compared additive vs. scaled dot-product attention tradeoffs empirically
PlateMate
Startup · ML ProductAI-powered food recommendation platform using collaborative filtering, RAG-based semantic search, and vector similarity over restaurant reviews.
Technical Highlights
- Hybrid recommendation engine: item-based collaborative filtering + semantic vector search
- RAG pipeline with
all-mpnet-base-v2embeddings (768-dim) for natural language dish queries - Query parsing into semantic + structured filters with geo-aware retrieval
- User-item interaction matrix for personalized collaborative filtering scores
- CTO — leading architecture decisions, ML pipeline design, and team of engineers
Cancer Cell Classification
Machine LearningMulti-method classification pipeline for identifying cancer cells in gene expression data, comparing PCA, SVM, Random Forest, and neural approaches.
Approach
- Dimensionality reduction via PCA on high-dimensional gene expression features
- Compared SVM, Random Forest, and logistic regression on cancer/non-cancer classification
- Evaluated precision-recall tradeoffs critical for medical classification tasks
- Completed for Matrix Methods in Machine Learning & Data Analysis